

NEW IN VERSION1.3 – ADDED MAPBOX MAPS CAROUSEL
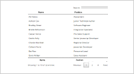
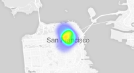
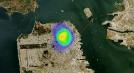
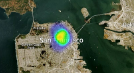
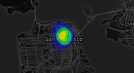
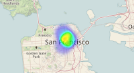
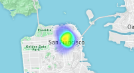
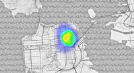
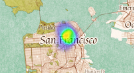
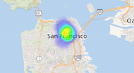
Drag and drop Mapbox maps, with Font Awesome icon markers or custom image markers or heatmaps, onto your dashboard, in a variety of Mapbox styles including: Streets, Satellite, Satellite Streets, Wheatpaste, Streets Basic, Dark, Comic, Outdoors, Run-Bike-Hike, Pencil, Pirates, Emerald, High Contrast. Check out how easy it is to create a dashboard with Mapbox maps in the “New in v1.3” tab!
NEW IN VERSION 1.2 – ADDED D3.JS CHART CAROUSEL
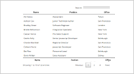
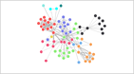
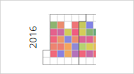
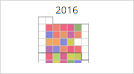
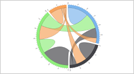
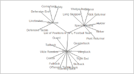
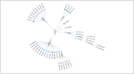
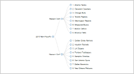
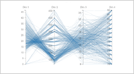
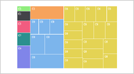
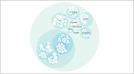
Drag and drop any of the the following popular D3.js charts/diagrams onto your dashboard- Cluster Force Layout (Bubbles), Force Graph Layout, Sticky Force Bubbles, Fancy Grouping Bubbles (Valandingham Bubbles), Calendar View (Horizontal), Calendar View (Vertical), Chord View, Code Flower, Collapsible Radial Tree, Collapsible Tree, Heirarchal Edge Bundling, Parallel Dimensions, Starburst, Treemap, Word Cloud, Zoomable Circle Packing. Create dashboards mixing matching D3.js, all other chart types available in this script. Check it out!
WHAT IS HTML5 DASHBOARD DESIGNER FOR THE CLOUD?
HTML5 Dashboard Designer for the Cloud, provides an easy to use, drag and drop user interface that allows non-programmers (and programmers alike) to build sophisticated dashboards (think dashboards you see in your favorite sci fi/action hero/spy movies) in minutes leveraging an extensible collection of popular Javascript and jQuery data visualization plug-ins. The script currently supports Mapbox, d3js, Highcharts, Highmaps, Highstock, Leaflet.js, Datatables.js but will support many many more in the future.
This dashboard designer uses standard (non-proprietary) HTML5/jQuery/Javascript to create a very light, easy to share dashboard. Dashboards can be previewed, shared and saved, jsfiddle-style (on the cloud thru automatically generated URL links). The script also includes a code generator that generates standalone scripts (4 different flavors – HTML5 Only, HTML/jQuery, URL string, Silent Form Post) to render the dashboard you created.
Chart data can be loaded from a file in a folder where you have this script installed or typed directly into the chart’s settings panel. Finally, full source code is available with every script purchase for you to customize, extend and incorporate into your own software.
Today’s “leading” data visualization tools are expensive, thick/heavy, closed/proprietary(e.g. source code not available) software products that produce average dashboards from a limited/closed selection of chart types and data visualizations (for list of current market leaders, see – 2015 Magic Quadrant for Business Intelligence and Analysis Tools).
In the meantime, open source Javascript and jQuery community software development has produced an exponentially growing catalog of innovative, next generation data visualization plugins/scripts (Highcharts, Highmaps, Highstock, Leaflet.js, Datatables.js, d3js, Mapbox etc.) that when assembled (using this new dashboard designer) into ultra-light data visualization web page using standard HTML5, jQuery and Javascript, produces sophisticated dashboards that provide the next generation data visualiation solution from the “leading tools” of today.
KEY FEATURES
- Create dashboards of any size form factor – any width by any height. Default is 5000×5000 pixels.
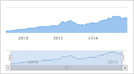
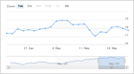
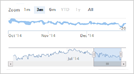
- Extensible rotating carousel “palette of JS/jQuery charts” including Mapbox, d3js, Highcharts, Highmaps, Highstock, Leaflet.js, Datatables.js. Many, many more to come including: Mapbox, eCharts, etc. available soon!
- Easy to use drag and drop dashboard designer user interface to create beautiful interactive dashboards in minutes. No coding necesarry! (see How to Videos)
- Settings panel for “no coding” chart customization – setting itles, text font, text size, chart background, series colors, etc
- DB agnostic data sources – Hand enter data or load data from a JSON file on your server.
- jsFiddle style saving/sharing – Ability to preview, share and save your dashboard on the cloud using auto generated URLs (* these features require PHP/MySQL webserver).
- Code Generator – auto generates code to render your dashboard in a standalone script. Different flavor scripts including: HTML5 Only, HTML5/jQuery, URL string (GET), Silent Form (POST)
- Theming capability. Change color scheme, fonts, background of dashboard by changing a single theme setting.
- Full source code available with every script purchase(< 10k lines) for you to extend, customize and incorporate into your own software.
SYSTEM REQUIREMENTS
- Any browser that supports HTML5/Javascript, jQuery (2.1.4). Tested with Chrome Version 49.0.2623.110 (64-bit), Safari Version 5.1.7 (7534.57.2), Internet Explorer 11.0.9600.18230, Firefox 5.0.2
- A PHP/MySQL supported webserver is required for jsfiddle features (preview, share, save) and render script options #3 and #4 – click here for phpinfo for PHP/MySQL versions and configuration options of the server serving up the demo. IMPORTANT: make sure to compare with phpinfo of your installation. Many PHP/MySQL errors stem from configuration options of customer php server instances.
- This script uses hosted libraries for Highsoft (code.highcharts.com, etc) and no installation required. It does require you to procure the appropriate Highsoft (Highcharts, Highmaps, Highstock) license based on your use. Click here for details.
- See ‘Installing this Script’ How To Video above for a demo of installation.
HOW TO VIDEO LIBRARY
- The Essentials
- Tour of Dashboard Designer’s UI
- Preview your Dashboard
- Sharing your Dashboard
- Saving/Updating your Dashboard
- Theming your Dashboard
- Data for your Dashboard
- Render using HTML5 only
- Render using HTML5/jQuery
- Render using a URL string(GET vars)
- Render using Silent Form (POST vars)
- Installing this Script
VERSION HISTORY
- VERSION 1.0 (4/15/2016) – Initial Launch Version
- Create dashboards for any size form factor – create dashboard of any width and any height.
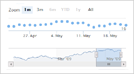
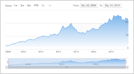
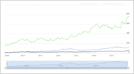
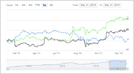
- Extensible rotating “palette of JS/jQuery charts” including Highcharts, Highmaps, Highstock, Leaflet.js, Datatables.js. Many, many more to come including , d3js, Mapbox available next release.
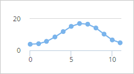
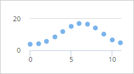
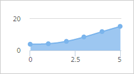
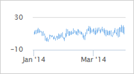
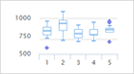
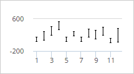
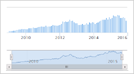
- Initial launch version includes the following charts you can build dashboards with:


- Easy to use drag and drop dashboard designer user interface to create beautiful interactive dashboards in minutes. No coding necesarry! (see How to Videos)
- Settings panel for “no coding” chart customization – setting itles, text font, text size, chart background, series colors, etc
- DB agnostic data sources – Hand enter data or load data from a JSON file on your server
- jsFiddle style saving/sharing – Ability to preview, share and save your dashboard on the cloud using auto generated URLs (* these features require PHP/MySQL webserver).
- Code Generator – auto generates code to render your dashboard in a standalone script. Different flavor scripts including: HTML5 Only, HTML5/jQuery, URL string (GET), Silent Form (POST)
- Theming capability. Change color scheme, fonts, background of dashboard by changing a single theme setting.
- Full source code made available with every script purchase(< 10k lines) for you to extend, customize and incorporate into your own software.
- VERSION 1.2 (7/15/2016) – 2nd release
- d3js New carousel of D3.js charts
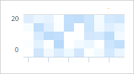
- Includes the following D3 charts/diagrams


- VERSION 1.3 (8/15/2016) – 3rd release
- Mapbox carousel of charts- includes


- VERSION 1.4 (realease date TBD) – backlog
- Layout carousel
- Live tile carousel
- More Highmaps (international)
- More Leaflet js maps
- Horizontal/Vertical carousel widgets
- eCharts carousel of charts
- Responsive Dashboards support using Bootstrap


My Other Scripts at Codecanyon:
– (BRAND NEW!!!) PHP Dashboard v5 (Enterprise Edition)
– PHP Daytrader’s Candlestick Pattern Hunter v1.0
– Twilio “Geo-text” Plug-In (a PHP Uber-style Geotracker Add On)
– PHP Uber-style GeoTracker
– PHP Dashboard v4.0 Collaborative Social Dashboards
– PHP Dashboard v3.0 – For Mobile Devices
– PHP Dashboard v2.7 – Responsive Carousels
– PHP Dashboard – NEW Version 1.2
– HTML5 Data-Driven Documents (D3js) Plug-In
– HTML5 Cloud Dashboard Designer
– HTML5 Streetmaps
– PHP Streetmaps
OTHER LINKS
- About Author – Data Ninja at Codecanyon.net
- Data Ninja Portfolio at Codecanyon.net
- Data Ninja’s Wordpress blog
- Data Ninja’s Youtube Video Channel
- Data Ninja’s Email:: dataninja.at.codecanyon@gmail.com
-

-

-
-

-

-


